Interview Analysis
PSP Builder analyzes and organizes respondent scores and comments collected in PSP customer interviews. It will help you thoughtfully interpret what customers are saying and to build persuasive cases for change in your organization that will improve future outcomes.
Each PSP customer interview first identifies the selection criteria that respondents used to judge vendors’ solutions. Then, the interview explores the importance of each of these criteria. Finally, the respondent rates each vendor vis-à-vis these criteria. Respondents' comments about why they rated you above or below the competition help you understand how they justified these ratings.
PSP Builder analytics combine all of these into a set of charts for interpretation and communication of findings throughout your organization. Here is a sampling of the most important ones.
The following example charts are for a fictional company called Active Consulting. The transcripts are based on real interviews conducted by PSP in the past, used with client permission. Vendor names have been changed to protect confidentiality.
WEAKNESSES AND STRENGTHS
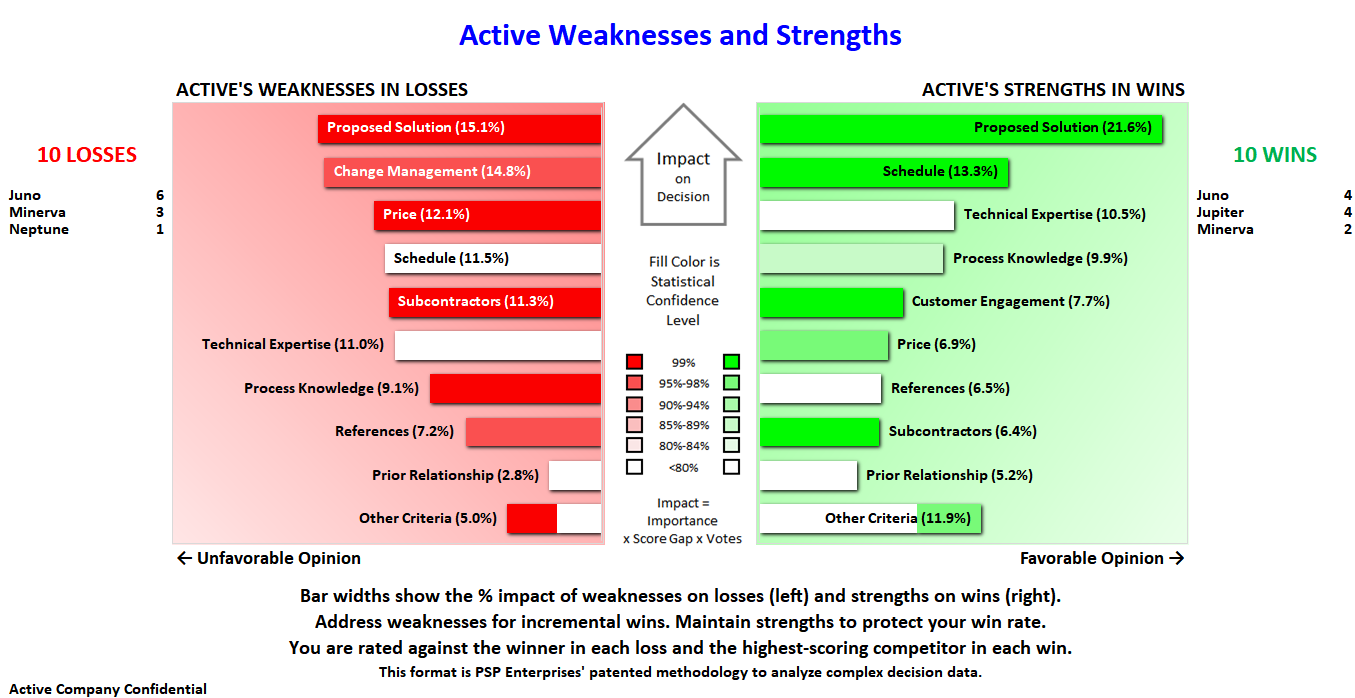
The Weaknesses and Strengths chart shows your strengths in wins and weaknesses in losses. The left and right sides of the Weaknesses and Strengths chart shows you the reasons you lost and won deals in rank order of their impact on lost and won outcomes respectively. Impact is measured as a % contribution to the outcome shown, or a revenue amount. To compute revenue impact, you need only enter your forecast revenue assumptions and win-rate.
The width of a bar is a probabilistic measure of its impact on the outcomes in aggregate. The impact of any given criterion represents how much it contributed to the won or lost decisions in the chart. Impact is based on:
- The importance of the criteria.
- The gaps between your scores and those of your competitors.
- The number of customers who cited those criteria.
As you scan the chart from top to bottom, the criteria move closer to the center and represent less extreme prospect opinions. The higher a selection criterion, the more that issue impacted the prospects’ decisions.
The bar chart's fill color shows the statistical confidence for each criterion. The deeper the color, the greater the statistical significance of the impact it represents. A deep green or red color is statistically significant to the 99% level. Pale colors have less statistical significance. A bar filled with white is less than 80% statistically significant. If the number of criteria exceeds the limits set for this chart, the lowest bar combines the remaining criteria and shows their combined impact and statistical confidence.
OPPORTUNITIES AND THREATS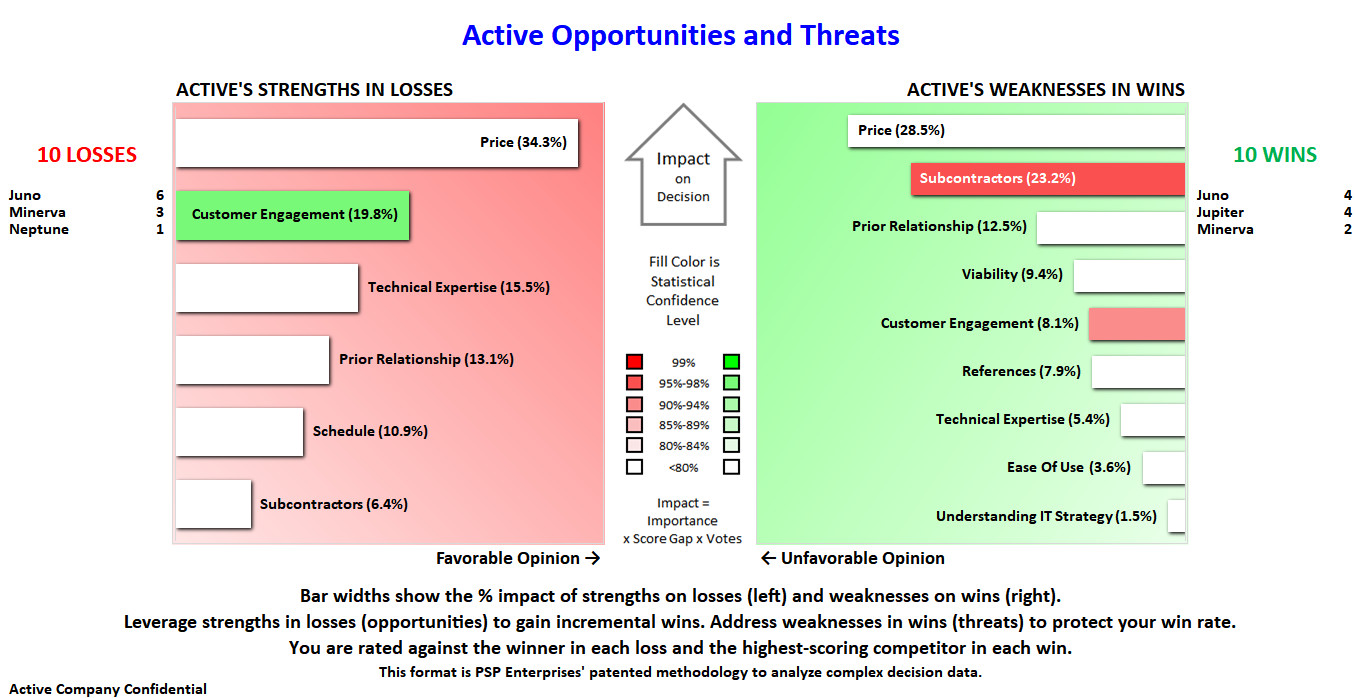
The Opportunities and Threats chart shows your strengths in losses and weaknesses in wins. It exposes the latent strengths and weaknesses that represent opportunities and threats for you.
These charts help answer the questions: "What if we were to counter the strengths of your competitors?" and "What if our competitors were to counter our strengths?" In conjunction with the Weaknesses and Strengths Chart, it provides a comprehensive SWOT analysis.
If criteria from Strengths and Weaknesses are different from those of Opportunities and Threats, it may mean that your losses are to customers whose needs are very different from those of your wins—i.e., they belong to a different market segment. Reversing these losses may require a strategic shift or investment. By contrast, if the criteria from these two charts are largely the same, it probably means that you lost for execution reasons (either product, communication, or both).
BATTLEPLAN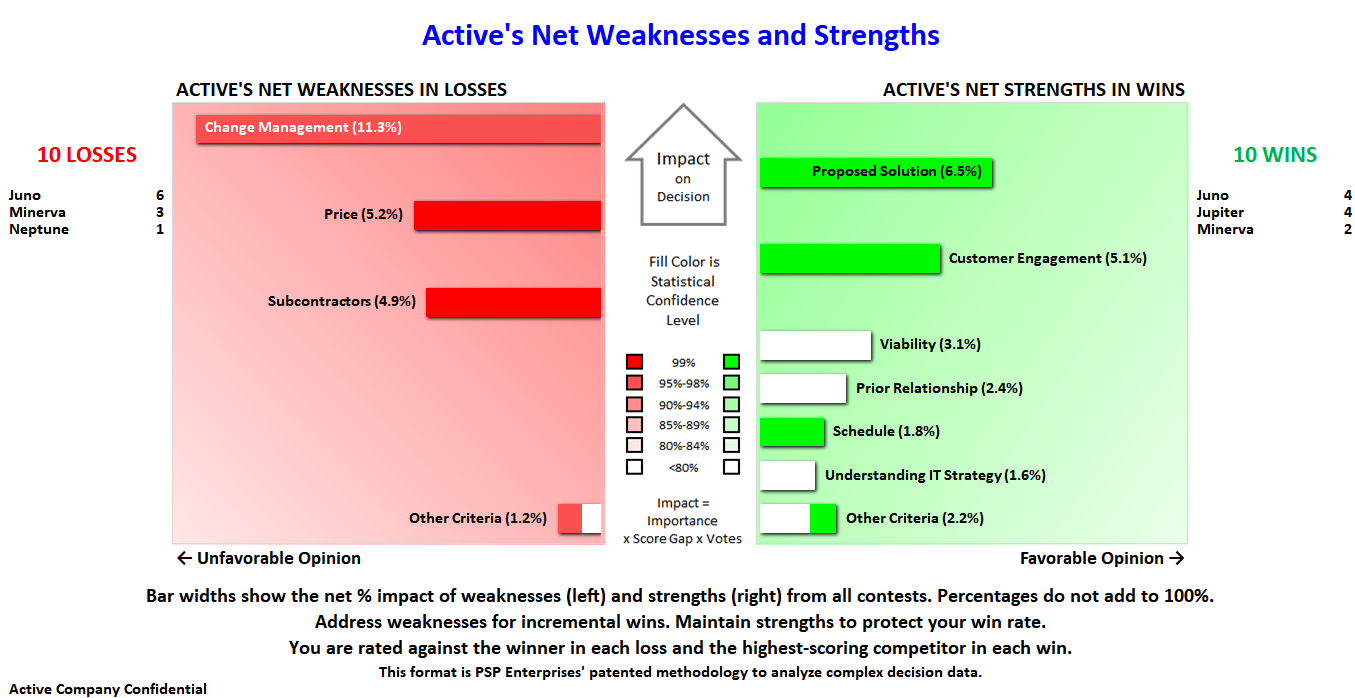
The BattlePlan chart combines and simplifies the Weaknesses and Strengths chart into this single chart of net weaknesses and strengths by subtracting weakness impact percentages from strength impact percentages. The net percentages are then sorted by absolute value to rank order the criteria. The resulting chart shows, in priority order, the standout criteria you should address to increase your win rate.
Plan your offense by addressing weaknesses and maintaining your strengths. Plan your defense with the Threats and Strengths Chart: Protect wins by maintaining your strengths and addressing latent weaknesses.
Use the BattlePlan in your presentations to focus attention on the issues which are your standout strengths and weaknesses across all deal outcomes. This chart, annotated with supporting customer quotes, is a persuasive tool to effect change in an organization.
CUSTOMER COMMENT DRILL-DOWN
PSP Builder can show you the customer quotes associated with the scores that they gave you and your competitors. Use these quotes to understand the reasons behind the ratings and to exemplify the actions you recommend in your reports and presentations. Nothing is more powerful than customers speaking in their own words, especially when stated in a blind and anonymous interview.
If you click on any bar in any chart, PSP Builder will open up adjacent windows to the right and display the customer quotes associated with that criterion.
In this example, we are drilling down into customer comments associated with the criterion "Proposed Solution" in the client's wins. Quotes in the top-right window are those expressing positive comments about the client. Quotes in the bottom-right window are those expressing negative comments about competitors. You can filter comments about competitors by any one or more competitors. This makes it easy to do competitive research.
The quotes are in green to show their connection with the wins. Had we clicked on a bar from the loss side, the quotes would be colored in pink.
WHATIFITRONTM
Conventional win/loss stops with an analysis of what happened in the past. PSP analytics forecast the revenue impact of competitive changes in the future—and help you optimize the competitive impact of your product and marketing investment.
The PSP Builder WhatifiTron is a predictive analytics tool that projects future win rate and bookings based on past results modified by adjustments you make for future conditions. You can use the WhatifiTron to estimate the economic impact of a competitive change—made by you or by competitors—in your marketplace.